Web applications are tested for performance and load using JMeter, a well-known open-source tool. This document will provide a comprehensive approach to testing web applications by teaching how to install and configure JMeter, run tests, create HTML reports using the graphical user interface, and generate reports using the command line.
What is JMeter?
Apache JMeter, which is entirely Java-based, is open-source software. Its purpose is to conduct web application performance, functional, and load testing. It is utilised explicitly for stress testing, functional behaviour analysis, and performance measurement.
Importance of Apache JMeter
- The load testing feature evaluates application performance under various loads by simulating multiple users.
- HTTP/HTTPS, JDBC, SOAP/REST, FTP, and other protocols are supported for compatibility.
- The intuitive GUI makes test plans easy for all skill levels, making it a user-friendly interface.
- Performance metrics are presented in detailed reports and graphs for comprehensive reporting and analytics.
- Continuous updates and comprehensive documentation are available with free community support for the open-source tool.
- Integration into CI/CD pipelines for automated testing is easy, providing automation and continuous integration.
- Simulate heavy user load by running tests from multiple machines with the support for distributed testing.
- Accurately simulate user behaviour through parameterisation and correlation, allowing for realistic test scenarios.
How to Configure Jmeter?
Prerequisite:
- Check Java is installed on your system. To check whether Java is installed or not, Open the CMD file and write
java -version
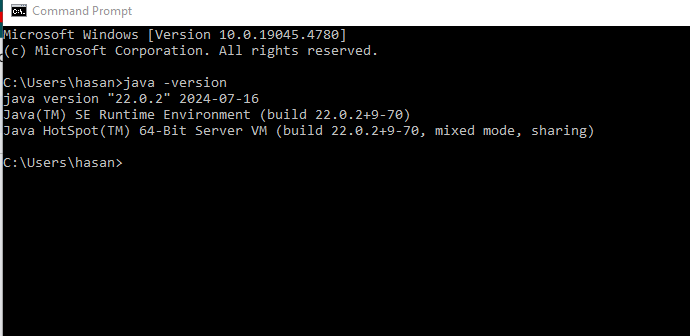
2. Go to the Apache Jmeter website: https://jmeter.apache.org/download_jmeter.cgi. Then, download the latest zip file from binaries. After downloading the zip file, unzip it and keep the Jmeter folder in any location.
How to Perform Tests in JMeter
To perform tests in JMeter, follow the following steps carefully,
01. Open the JMeter Windows batch file from the bin folder in the apache-jmeter-5.6.3
02. Create a Test Plan: Open JMeter and create a new test plan by clicking on File > New.
03. In the Test Plan, Add a Thread Group: Right-click on Test Plan > Add > Threads (Users) > Thread Group.
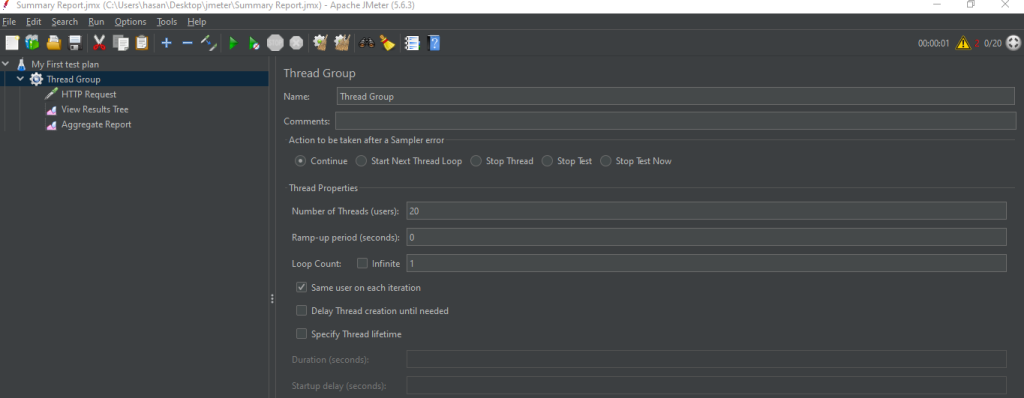
Configure the Thread Group
Need to Know:
- Number of Threads (Users): The number of virtual users.
- Ramp-Up Period: The time JMeter takes to start all the users.
- Loop Count: The number of times the test will repeat. You can also check the Forever option to make it run continuously.
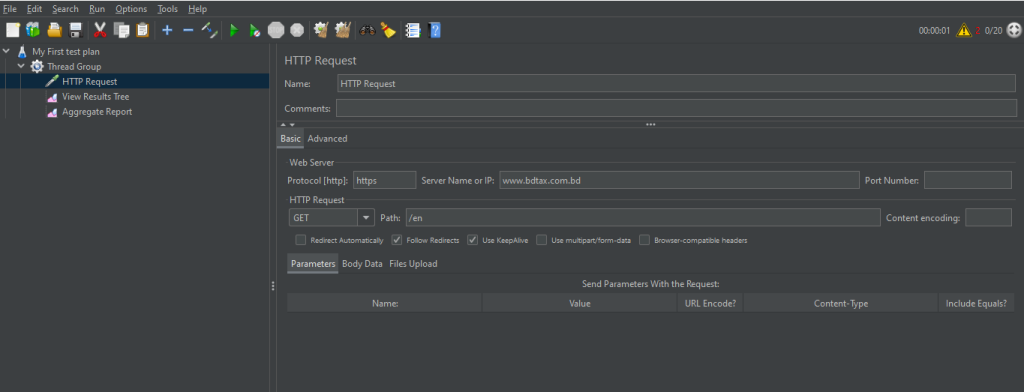
04. Add HTTP Request Sampler
- Right-click on Thread Group > Add > Sampler > HTTP Request.
- Configure the HTTP request by specifying the server Name or IP. Enter the domain (e.g., www.example.com).
- Path: Enter the specific path to the resource you’re testing (e.g., /api/test).
- Method: Choose the HTTP method (GET, POST, etc.).
- Add other details like parameters or headers if required
05. Add Listeners
- Right-click on Thread Group > Add > Listener.
- Choose a listener like View Results Tree, Graph Results, or Summary Report to visualize the test results.
- Each individual listener can analyze the test results in various ways.
06. Run
- Confirm that all components are properly set up before initiating the test.
- Commence the test by clicking on the start button, indicated by a green play icon
07. Evaluate the Outcomes
- Assess the observer you included to examine performance metrics like response times, throughput, and errors.
How to Generate HTML Reports from GUI
To generate HTML reports manually
- Right-click on Thread Group > Add > Listener.
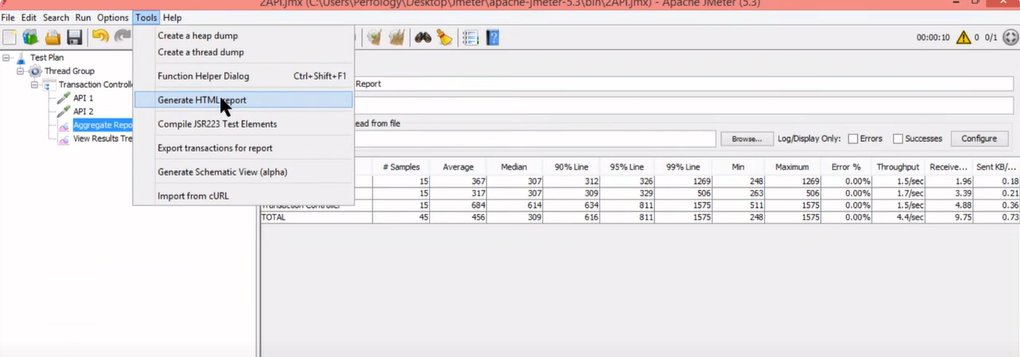
- Choose a listener like View Results Aggregate Report to visualise the test results.
- Add file name, and file name should be example.csv
- After finishing the test, we must go to Tools options and click generate HTML report.

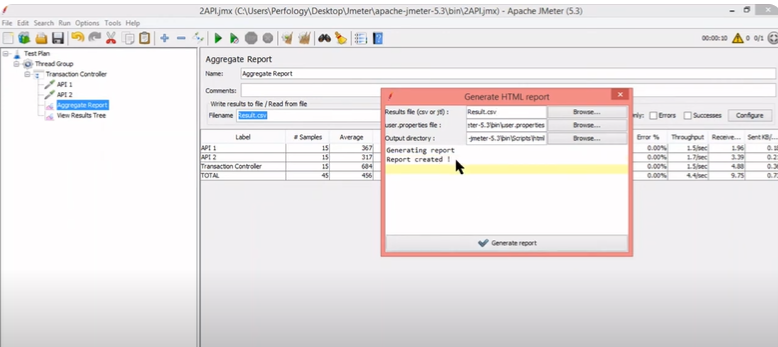
- Put the file name in the Result file
- After that, we need to provide the path of the user.properties file, Which is situated in the bin directory of the JMeter folder.
- Lastly, we need to provide the path of the folder in the output directory, and the folder needs to be empty.
- Then click on Generate report.
How to Run Test Plan Using Command Line
Prerequisites: JMeter 3.0 or later is required to generate dashboard reports
To generate an HTML report for a load test in JMeter, follow these steps:
Step 1: Create a test plan and save it
Step 2: Open the command line and change the directory to jmeter/bin
Step 3: Execute command
jmeter -n -t "location of jmeter test script" -l "location of the result file" -e -o "location of the output folder"Example:
jmeter -n -t "\Users\hasan\Desktop\Drive\apache-jmeter-5.6.2\bin\Testreport.jmx" -l "\Users\hasan\Desktop\\Report\result.csv" -e -o "\Users\hasan\Desktop\Report"Step 4: Go to Desktop >> Report folder and click index (Chrome HTML Document) to view the HTML report.
JMeter is an essential tool for web application performance and load testing. This guide covers installation, configuration, testing and reporting via GUI and command line, simplifying performance evaluation. JMeter is expected to be expanded to include more robust testing capabilities.

